Women in Data is an international non-profit organization dedicated to increasing diversity in data-related careers by organizing conferences, networking events, and mentorship programs around the world. The Berlin Chapter of WiD was just founded in May this year and I was very excited to join as a Marketing Coordinator.
29 posts tagged with "data science"
View All Tags4 tips for creating a great data science portfolio
It is a truth universally acknowledged that a data scientist in possession of a good portfolio must be in want of a job. A curated selection of your projects is the best way to showcase your work, interests, and thinking to potential employers. But what makes a "good portfolio"?
From my experience and discussions with colleagues, I summed up four tips that you should apply to make your data science portfolio stand out from the crowd.
The Pitfalls of Deep Learning (WAD talk)
We Are Developers is the world’s largest conference for software development. It’s a great opportunity for software engineers to connect with tech companies and learn about interesting advances in technology. This year, WAD was supposed to take place in Berlin, but due to COVID-19, the event was moved online for a Live Week (25-29 May) of exciting talks on different tech topics.
On the second day, I tuned in to watch Adrian Spataru‘s and Bohdan Andrusyak‘s talk The pitfalls of Deep Learning – when Neural Networks are not the solution.
Diversity in IT Jobs (WAD talk)
We Are Developers is the world's largest conference for software development. It's a great opportunity for software engineers to connect with tech companies and learn about interesting advances in technology. This year, it was supposed to take place in Berlin, but due to COVID-19, it was moved online for a Live Week (25-29 May) of exciting talks on different tech topics.
On the first day, I tuned in to watch Christoph Pirringer's talk on Diversity in Development: Which hurdles can we overcome right now to open up development?
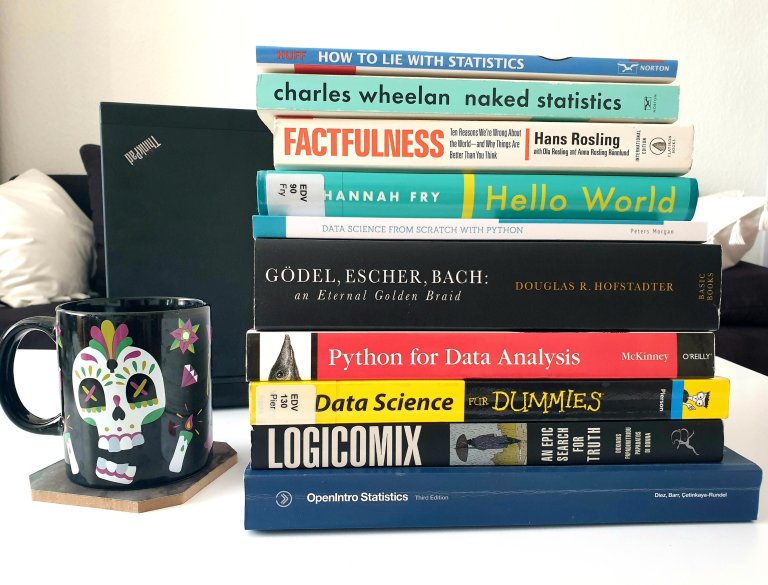
10 data science books to read during lockdown

If you're reading this post around its publishing date in April 2020, chances are you're at home, responsibly isolating yourself amid COVID-19 curfews around the world. What a better time than now to read actual books on data-related topics, that you've been postponing for too long in favor of short articles...
To give you some food for thought for these days, I curated a top 10 list of books straight from my bookshelves.
Der Stand der Bibliotheken in Deutschland
Am 23. April 2020 feiern alle Bücherwürmer den Welttag des Buches! Letztes Jahr habe ich zu diesem Anlass eine Infografik zum Stand der Buchproduktion in Österreich erstellt. Dieses Jahr liegt mein Fokus auf der Situation der Bibliotheken in Deutschland.
Goodreads Reading Challenge 2019
As the year is almost over, it's time to review my one and only resolution that I've been sticking to for the past four years: the Goodreads Reading Challenge. For 2019 I set quite a reasonable goal of reading 24 books, an average of two per month.
To combine my love for literature and data analysis, I've created a dataset with key information about the books I've read this year and visualized it in an interactive dashboard with Google Data Studio.
Web-scraping IMDb with R
Web scraping is a method of automatically gathering data from websites in a structured manner and storing it into a local database or spreadsheet. Why would you do this? Because you're lazy. Or because it's really impossible to copy-paste all the data you need from the website.
Some popular use-cases of web scraping are price comparison sites of products from different companies, lead generation from collected contact information, trend analysis of popular topics in a certain location. I simply wanted to see what are the most popular movies of 2018 and what features they have.
Analyzing my reading habits from Goodreads data
Goodreads is an amazing platform for tracking and organizing your reading, discovering new books, and sharing reviews or recommandations with friends.
On my quest to becoming a data scientist, I've recently played with my goodreads data to get some insights into my reading habits in the past six years. You can have a look in the GitHub repo at the full dataset and basic analysis with Python. For a quick and colorful overview, I create two interactive dashboards: one in Google Data Studio and one in Tableau.